
 PDF Download
 PubReader
 Export Citation
 Email the Author
 Share Facebook
 Share Twitter
 Cited by 0 Article
 Metrics (View:68)






1. Introduction
In L2 writing, the complexity and variety of syntactic structures produced by learners have generally been considered to reflect their level of language development (e.g., Kuiken and Vedder 2019; Martínez 2018). Accordingly, syntactic complexity has been widely used in writing assessment, proficiency evaluation, and research on L2 development (e.g., Barrot and Agdeppa 2021; Grant and Ginther 2000; Hwang 2025; Kim and Crossley 2018; Kyle and Crossley 2018; Li and Yang 2023; Sarte and Gnevsheva 2022; Vyatkina 2012; Wu and Lu 2024). In particular, advances in computational tools capable of capturing various aspects of syntactic complexity, including subordination, coordination, phrasal elaboration, and the length of production units, have enabled researchers to measure syntactic complexity using multiple indices at different structural levels, such as clauses, T-units, sentences, and phrases, stimulating extensive research on the multidimensional nature of syntactic complexity.
However, these different dimensions of syntactic complexity do not necessarily develop in the same way, and syntactic complexity needs to be regarded as a multidimensional construct, with different dimensions becoming more important at different levels of proficiency. Norris and Ortega (2009) proposed that the primary source of syntactic complexity may shift from coordination to subordination and eventually to phrasal elaboration as proficiency develops. Biber, Gray, and Poonpon (2011) further argued that, in advanced academic writing, phrasal complexity, particularly complex noun phrases, is a more important characteristic than clause-level subordination. In addition, Bulté and Housen (2014) reported that commonly used subordination-based measures may not adequately capture short-term development, indicating that syntactic development should be examined using multiple dimensions rather than relying on subordination alone. These studies suggest that different dimensions of syntactic complexity may follow different developmental patterns. Nevertheless, relatively few studies have examined from a continuous perspective how multiple dimensions change together or differently over the course of development.
To investigate such developmental patterns, longitudinal data that track the same learners over time are ideal. However, collecting longitudinal data is time-consuming and costly, and it is often difficult in practice to build large datasets covering a sufficient number of time points. Because of these constraints, many studies have relied on cross-sectional approaches that compare learners at different proficiency levels (e.g., Lu 2011; Verspoor, Schmid, and Xu 2012). However, comparisons of mean values across proficiency groups treat development as a limited number of discrete stages, making it difficult to capture in detail how syntactic complexity changes along a continuous developmental process and how its multiple dimensions change together throughout this process.
To address these limitations, the present study proposes an approach that reconstructs developmental ordering without requiring long-term longitudinal observation by ordering cross-sectional observations along an inferred developmental continuum, or pseudotime. Specifically, the present study applies PCA1 to a theoretically selected subset of syntactic complexity indices to construct a continuous developmental axis (pseudotime). It then quantitatively models how other syntactic complexity indices change along this axis using GAMs and bootstrap-based simultaneous confidence bands.
The present study aims to examine whether the pseudotime axis can function as a developmental axis and whether different dimensions of syntactic complexity exhibit similar or distinct patterns along this axis from a continuous perspective. Accordingly, the present study addresses the following two research questions:
2. Literature Review
Advances in computational tools for the automatic measurement of syntactic complexity have encouraged research on syntactic complexity. In particular, tools such as L2SCA have made it possible to automatically calculate multiple indices at different structural levels, including clauses, T-units, sentences, and phrases, thereby providing researchers with a basis for empirically examining the multidimensional nature of syntactic complexity. Table 1 presents 14 syntactic complexity indices generated by L2SCA (Lu 2010), which have been widely used in L2 writing research. These 14 indices can be classified into five categories: length of production units, sentence complexity, subordination, coordination, and particular structures. Many researchers have used these indices to compare syntactic complexity across proficiency levels or L1 groups (e.g., Khushik and Huhta 2020; Lu 2011; Lu and Ai 2015; Yoon 2017).
For example, Lu (2011) conducted a cross-sectional comparison of the 14 L2SCA indices using the WECCL, with university year levels (Years 1–4) serving as a proxy for proficiency. After controlling for institutional, genre, and timing conditions, the study examined which indices significantly distinguished adjacent proficiency levels. The results showed that only 10 of the 14 indices significantly differentiated levels. Measures of length, nominal complexity, and phrasal coordination (MLC, MLS, MLT, CN/T, CN/C, CP/T, and CP/C) increased at higher levels, whereas C/S, DC/C, and DC/T decreased. In contrast, C/T, CT/T, T/S, and VP/T did not show significant differences across levels.
Lu and Ai (2015) examined how syntactic complexity in college-level English argumentative writing varied according to learners’ L1 backgrounds. Their dataset consisted of 200 essays written by native English-speaking U.S. university students from LOCNESS and 1,400 essays written by EFL learners from seven different L1 backgrounds in ICLE 2.0, with 200 essays from each L1 group. All essays were analyzed using the 14 syntactic complexity indices generated by L2SCA. When the learners’ L1 backgrounds were ignored and all NNSs were compared with NSs as a single group, significant differences were found in only three of the 14 indices: MLC, CN/C, and CN/T. However, when the learners were separated according to L1 background, significant differences emerged in all 14 indices between the NS group and at least one L1 group, and the individual L1 groups differed from the NS group in substantially different ways.
Taken together, studies comparing individual dimensions of syntactic complexity across groups suggest that syntactic complexity cannot be adequately treated as a single, unitary characteristic. Different dimensions may show different directions and degrees of change across groups; significant differences may appear in some indices but not in others, and the patterns of difference may also vary across groups. This aligns with Norris and Ortega’s (2009) view of syntactic complexity as a multidimensional construct with distinct subdimensions. Norris and Ortega (2009) proposed that syntactic complexity should be assessed across multiple dimensions, including global complexity, subordination, coordination, and phrasal elaboration. They further emphasized that the primary source of syntactic complexity may change as proficiency develops. Coordination may play a relatively important role at earlier stages, followed by greater use of subordination, while phrasal elaboration may become a more important resource at higher proficiency levels.
From this perspective, the development of syntactic complexity can be regarded not as a process in which all syntactic structures increase uniformly with proficiency, but rather as a process in which different dimensions of syntactic complexity become more prominent at different stages of development. Therefore, a more accurate understanding of syntactic complexity development requires moving beyond group comparisons of individual indices and examining how multiple dimensions change together across a continuous developmental process.
Two main approaches have been used to investigate how syntactic complexity changes over the course of learner development. One is a longitudinal approach, which repeatedly observes the same learners over a period of time, and the other is a cross-sectional approach, which compares learners at different proficiency levels at a single point in time. Although the longitudinal approach is ideal in that it allows researchers to directly observe development, collecting data from the same learners over an extended period with a sufficient number of observation points is difficult in terms of both time and cost. Indeed, longitudinal studies of changes in syntactic complexity have been relatively rare and have often been limited by small sample sizes or a small number of observation points (Kim 2021). Because of these constraints, many studies have relied on cross-sectional approaches, indirectly inferring developmental patterns by comparing learners at different proficiency levels (e.g., Jiang, Bi, and Liu 2019; Kuiken and Vedder 2019; Lu 2011; Verspoor, Schmid, and Xu 2012).
As an example of the longitudinal approach, Kim (2021) examined longitudinal changes in lexical and syntactic features in the writing of beginning-level Korean EFL university students. The study analyzed 630 essays produced by 90 learners at seven time points over an academic semester. LME models, which treated time as a continuous variable and accounted for individual differences among learners, were used to examine changes in 13 measures (one text-length measure, seven lexical measures, and five syntactic measures), while repeated measures correlations were used to investigate longitudinal relationships among the features. The results showed significant developmental patterns in lexical features, including the use of more sophisticated content words and an increased use of function words. In contrast, little significant change over time was found in syntactic complexity, with CN/C being the only measure that changed significantly, and it showed a decreasing pattern. Kim suggested that beginning-level learners may develop lexical features to a greater degree than syntactic features and that commonly used syntactic complexity measures may not be sufficiently sensitive to capture short-term developmental changes over a single semester.
In contrast, Jiang, Bi, and Liu (2019), representing the cross-sectional approach, examined syntactic complexity cross-sectionally in 410 narrative essays written by beginner- and intermediate-level EFL learners across four proficiency levels. Seven large-grained measures were obtained using L2SCA, and eight fine-grained measures were extracted from a dependency-annotated corpus. For the statistical analyses, MANOVA and post hoc tests were applied to measures that met the assumptions of normality and homogeneity of variance, whereas the Kruskal–Wallis test was used for measures that did not meet these assumptions to determine which measures best discriminated and predicted writing proficiency. The results showed that most large-grained measures increased with proficiency, with MLT, MLS, and DC/C showing particularly strong discrimination across levels, whereas CP/C did not. Fine-grained analyses showed greater use of subordinate clauses and post-nominal modifiers at higher levels, while compound nouns decreased and complement clauses followed a nonlinear pattern. They interpreted these findings as supporting a developmental shift from coordination to subordination and then to phrasal elaboration, and emphasized that syntactic complexity develops dynamically across multiple dimensions.
Although many studies have relied on the cross-sectional approach because of its advantages, it also has several limitations. By dividing development into a small number of discrete stages or groups for comparison, this approach makes it difficult to capture in detail how syntactic complexity changes along a continuous developmental process and how its multiple subdimensions change together or differently over that process (O’Leary and Steinkrauss 2022; Verspoor, Schmid, and Xu 2012). Comparisons across proficiency levels show only mean differences between adjacent groups and do not model development as a continuous process. To address this gap, the present study proposes a new analytical approach that reconstructs development from large-scale cross-sectional data along a continuous axis without requiring longitudinal data and examines how multiple dimensions of syntactic complexity change along that axis.
3. Methods
The present study utilized data from the ICNALE (https://language.sakura.ne.jp/icnale/download.html; Ishikawa 2013) because it provides a large learner sample, common writing tasks across groups with different first-language backgrounds, learner-level proficiency information, and detailed background survey data. ICNALE includes English data from learners representing 10 Asian L1 backgrounds: CHN, HKG, IDN, JPN, KOR, PAK, PHL, SIN, THA, and TWN. The corpus is organized into five modules—Spoken Monologue, Spoken Dialogue, Written Essays, Written Essays Plus, and Edited Essays—of which only the Written Essays module was analyzed in this study.
The dataset analyzed in the present study, which included 10 Asian L1 groups and ENS, consisted of 5,598 argumentative essays produced by 2,800 participants (two prompts per learner, with two exceptions for whom only one prompt was available). Each learner responded to two controlled prompts: (i) whether it is important for college students to have part-time jobs and (ii) whether smoking should be completely banned in restaurants. The learners were required to write an essay using a word processor within 20–40 minutes, with a target length of 200–300 words. Dictionary use was not permitted to reduce external assistance that might affect the linguistic characteristics of the written production. Asian learners’ proficiency was classified into four ICNALE proficiency bands aligned with the CEFR: A2_0, B1_1, B1_2, and B2_0. A2_0 corresponds to the pre-intermediate level, B1_1 and B1_2 to the intermediate level, and B2_0 to the upper-intermediate level. The distribution of essays by L1 background and proficiency level is presented in Table 2. The dataset was unevenly distributed across proficiency levels, with B1_1 and B1_2 essays accounting for the largest proportions. By contrast, the 400 essays written by 200 ENS participants were not divided into proficiency levels.
Values for 14 syntactic complexity indices were calculated from the argumentative essay dataset using the L2SCA measures implemented in the TAASSC (Kyle 2016). To construct a developmental pseudotime for syntactic complexity, a subset of the 14 syntactic complexity indices was selected based on a theoretical review. Given the relatively narrow CEFR proficiency range in the dataset used in the present study (from A2_0 to B2_0) and the finding by Bulté and Housen (2014) that subordination-ratio indices may not sufficiently capture short-term developmental changes, subordination-focused indices were excluded. As Biber, Gray, and Poonpon (2011) suggested that, in advanced academic writing, phrase-level complexity, such as complex noun phrases, is relied on more heavily than clause-level complexity involving embedded or dependent clauses, CN/C, which represents complex nominals per clause, was selected. CN/T, another complex nominal index, was excluded because it exhibited extremely high correlations with subordination-related indices, specifically C/T (r ≈ .92) and DC/T (r ≈ .91). In addition, Norris and Ortega (2009) viewed syntactic complexity as a multidimensional construct and proposed that the primary source of complexity shifts from coordination to subordination and ultimately to phrasal elaboration over the course of development. Accordingly, the coordination-related indices CP/C and CP/T were selected. Finally, MLC was selected as a length-based index capable of capturing phrasal expansion and structural elaboration within clauses.
To evaluate the suitability of the four selected indices (CN/C, CP/C, CP/T, and MLC) for constructing the developmental pseudotime, Bartlett’s test of sphericity was conducted, the KMO measure of sampling adequacy was calculated, and individual MSA was computed for each index. After the statistical appropriateness of summarizing the four indices along a common dimension was confirmed, the four indices were standardized so that no single index would dominate due to scale differences. Then, PCA was performed to reduce them to a single composite value. The percentage of the total variance accounted for by the PC1 was examined, and its retention was further supported by Horn’s parallel analysis based on the 95th percentile of eigenvalues from 1,000 randomly generated datasets. PC1 was oriented using MLC and CN/C so that higher scores indicated greater phrasal elaboration. Finally, the resulting PC1 scores were rescaled to range from 0 to 1 using min–max scaling, and the rescaled score was defined as pseudotime representing each learner’s position along the syntactic developmental axis.
To verify whether the pseudotime axis reflects actual proficiency development, three validation procedures were conducted. First, to prevent the two essays written by the same learner from being treated as independent samples, a mean pseudotime score was calculated for each learner. Using these learner-level scores, the study examined whether the mean pseudotime increased sequentially across the CEFR levels (A2_0 < B1_1 < B1_2 < B2_0 < ENS). Secondly, Welch’s ANOVA and Games–Howell post hoc tests were used to assess the statistical significance of mean pseudotime differences across the proficiency groups. Thirdly, Spearman’s rank correlation was used to verify the monotonic relationship between the CEFR proficiency and pseudotime. In addition to assessing the construct validity of the pseudotime axis, its structural stability was evaluated by performing 1,000 learner-level bootstrap resamples, reapplying PCA to the four indices in each iteration, and estimating the sign stability and 95% confidence intervals of the PC1 loadings.
After establishing the validity of the pseudotime axis as a developmental trajectory of syntactic complexity, changes in the syntactic complexity indices not used in axis construction were analyzed along this developmental timeline. Among the remaining 10 indices (14 – 4), highly correlated and redundant measures were removed, and only the representative indices for each dimension were included in the final analysis. Specifically, indices showing learner-level correlations of |r| ≥ .80 were treated as redundant. MLS was highly correlated with MLT (r = .81), DC/T with C/T (r = .98), CT/T with DC/C (r = .89), and VP/T with CN/T (r = .87); therefore, MLS, DC/T, CT/T, and VP/T were excluded. As a result, six indices were retained: C/T and DC/C for subordination, MLT for length, C/S for syntactic complexity, T/S for coordination, and CN/T for phrasal complexity. With the pseudotime score for each learner as a continuous explanatory variable (x-axis) and C/T, DC/C, MLT, C/S, T/S, and CN/T as outcome variables (y-axis), GAMs based on penalized B-splines were fitted. Aggregating both the explanatory and outcome variables to learner-level mean values eliminated the non-independence arising from treating two essays written by the same learner as separate independent observations. Each GAM used a cubic B-spline basis (basis dimension = 10), with the smoothing penalty parameter fixed at α = 1. EDF were estimated for each smooth to assess the degree of nonlinearity in the fitted curves. An EDF of approximately 1 indicates an almost linear relationship, whereas larger EDF values indicate increasingly complex nonlinear patterns.
Since the fitted curves obtained through GAMs are based on a specific sample, namely the ICNALE written essay sample, their shapes may vary across samples. Therefore, the statistical stability of the results was evaluated by presenting confidence bands that reflect this uncertainty. Specifically, curve uncertainty was estimated using learner-level bootstrapping. The learner sample was resampled with replacement 300 times, with the curve refitted once for each resample. During this process, any resamples for which model fitting failed were discarded and replaced by newly drawn resamples rather than by the original curve, thereby preventing bootstrap variability from being artificially deflated. To determine the boundaries of the 95% simultaneous confidence bands from the 300 bootstrap curves, standardized deviations between the original fitted curve and the bootstrap curves were calculated at each pseudotime point.
Taking the first bootstrap curve as an example, at each of the 200 points along the pseudotime axis, we calculated the deviations of the first bootstrap curve from the original estimated curve. These deviations were then divided by the standard deviation of the values obtained across the 300 bootstrap iterations at each point (i.e., the bootstrap standard error) to obtain the standardized deviation. Next, the maximum absolute value among the 200 standardized deviations from the first bootstrap curve was identified. By repeating this procedure for the remaining 299 bootstrap curves, a total of 300 maximum absolute standardized deviations were obtained. These values were ordered from smallest to largest, and the 95th percentile of the resulting empirical distribution was used as the critical value for determining the width of the 95% sup-t simultaneous confidence band. At each pseudotime point, the width of the confidence band was determined by multiplying this critical value by the bootstrap standard error at that point. Intervals of significant change were defined as regions where the simultaneous confidence band for the slope of the curve (i.e., the first derivative) did not include zero, because a slope of zero indicates no increase or decrease in the fitted curve. To address potential estimation instability at the boundaries, where sparse data at the extreme ends of the pseudotime axis might produce spurious curvature, the outer 1% at each end was trimmed, and only the central 98% of the axis was evaluated. All these analyses in the present study were conducted in Python (version 3.14.3).
4. Results
Prior to the construction of the developmental axis (pseudotime), the statistical appropriateness of summarizing the four selected indices (MLC, CP/T, CP/C, and CN/C) into a single principal component was evaluated. Bartlett’s test of sphericity was significant, χ2(6) = 6,815.5, p < .001, indicating that the indices were sufficiently correlated for PCA. The overall KMO measure of sampling adequacy was .60, meeting the acceptable threshold, and all individual MSAs exceeded .50 (MLC = .69, CN/C = .71, CP/C = .57, and CP/T = .56), supporting the suitability of the four indices for PCA.
Next, the four indices were standardized, and PCA was conducted. PC1 explained 54.6% of the total variance (eigenvalue ≈ 2.18), with positive loadings for all four indices (CP/C = .87, CP/T = .81, CN/C = .66, and MLC = .58). Horn’s parallel analysis based on 1,000 randomly generated datasets and the 95th-percentile criterion indicated that PC1 was the only component whose observed eigenvalue exceeded the corresponding random threshold, thereby further supporting the retention of PC1. PC1 was oriented using CN/C and MLC as theoretical reference indices because CN/C is a key index directly reflecting nominal elaboration, whereas MLC reflects overall structural expansion within clauses; accordingly, the direction of the axis was oriented to align with the signs of these two indices. Finally, the PC1 scores were rescaled to a range from 0 to 1 using min–max scaling, and the resulting values were defined as pseudotime.
Three validation procedures were used to assess whether the pseudotime axis reflected actual proficiency development. First, the mean pseudotime score averaged across the two essays for each learner was examined across CEFR proficiency levels. The result showed a monotonic increase, with the mean pseudotime of each proficiency rising sequentially from A2_0 (M = .138, SD = .05) to B1_1 (M = .139, SD = .04), B1_2 (M = .157, SD = .05), B2_0 (M = .163, SD = .05), and ENS (M = .172, SD = .05). Second, Welch’s ANOVA indicated significant differences across proficiency groups (p < .001, η2p = .07). Games–Howell post hoc comparisons further showed significant differences in 7 of the 10 pairwise contrasts. The adjacent contrasts A2_0 and B1_1, B1_2 and B2_0, and B2_0 and ENS were not significant, suggesting that the developmental signal was concentrated mainly in the transition from lower-intermediate to higher-intermediate proficiency. Third, Spearman’s rank correlation showed a significant positive monotonic relationship between learner-level pseudotime averaged across the two essays for each learner and the ordered CEFR proficiency levels (rs = .27, p < .001). In addition to this construct-related evidence, the structural stability of the pseudotime axis was examined by reapplying PCA to the four indices across 1,000 learner-level bootstrap resamples. The PC1 loadings retained the same sign in all bootstrap iterations (sign stability = 1.00), and none of their 95% confidence intervals included zero, indicating that the structure of the developmental axis was stable across resampled datasets. Given the modest effect size, the pseudotime axis was interpreted as reflecting proficiency development in a small but consistent manner.
Penalized B-spline GAMs were fitted with pseudotime as the continuous explanatory variable and each of the six syntactic complexity indices (C/T, DC/C, MLT, C/S, T/S, and CN/T) as the outcome variable. Each GAM used a cubic B-spline basis (basis dimension = 10), with the smoothing penalty parameter fixed at α = 1. The EDFs were approximately 1.03 across all indices, indicating that the fitted curves were essentially linear. Figure 1 presents the fitted curves with 95% sup-t simultaneous confidence bands obtained through learner-level bootstrapping, and Figure 2 presents their first derivatives with the corresponding 95% sup-t simultaneous confidence bands (the darker shading represents the 95% simultaneous confidence band for the first derivative, whereas the lighter background shading indicates intervals where the band excludes zero and thus denotes statistically significant change). A horizontal reference line was drawn at y = 0 (slope = 0) to determine whether the confidence band for the first derivative included zero.
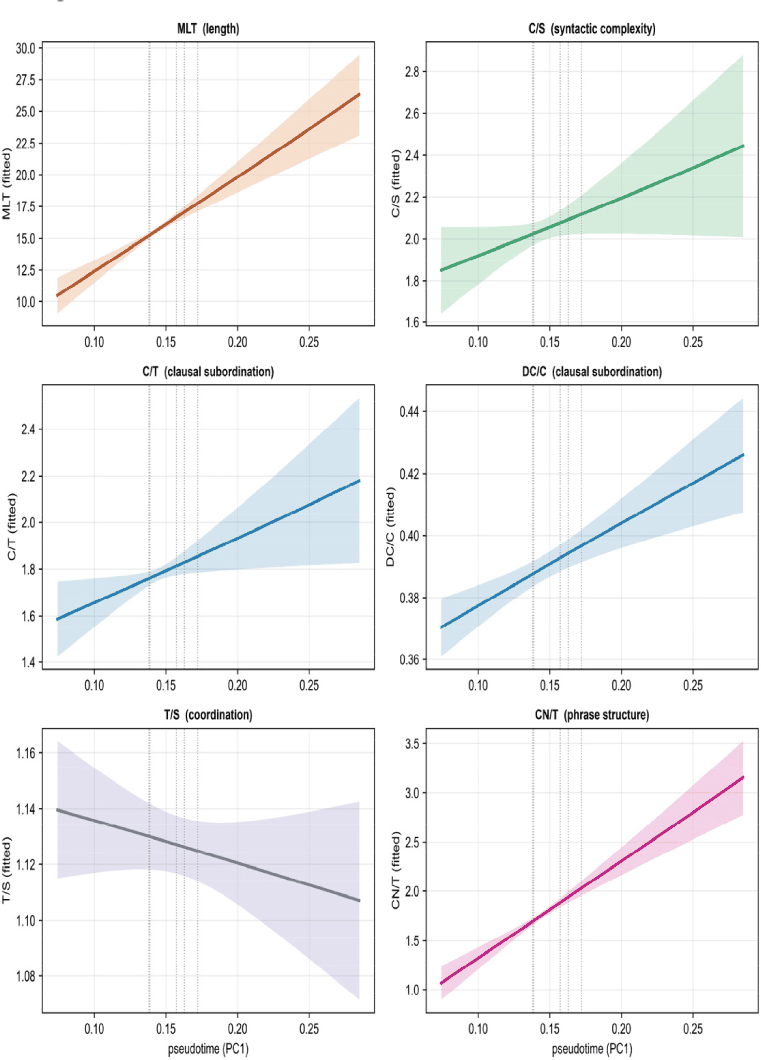
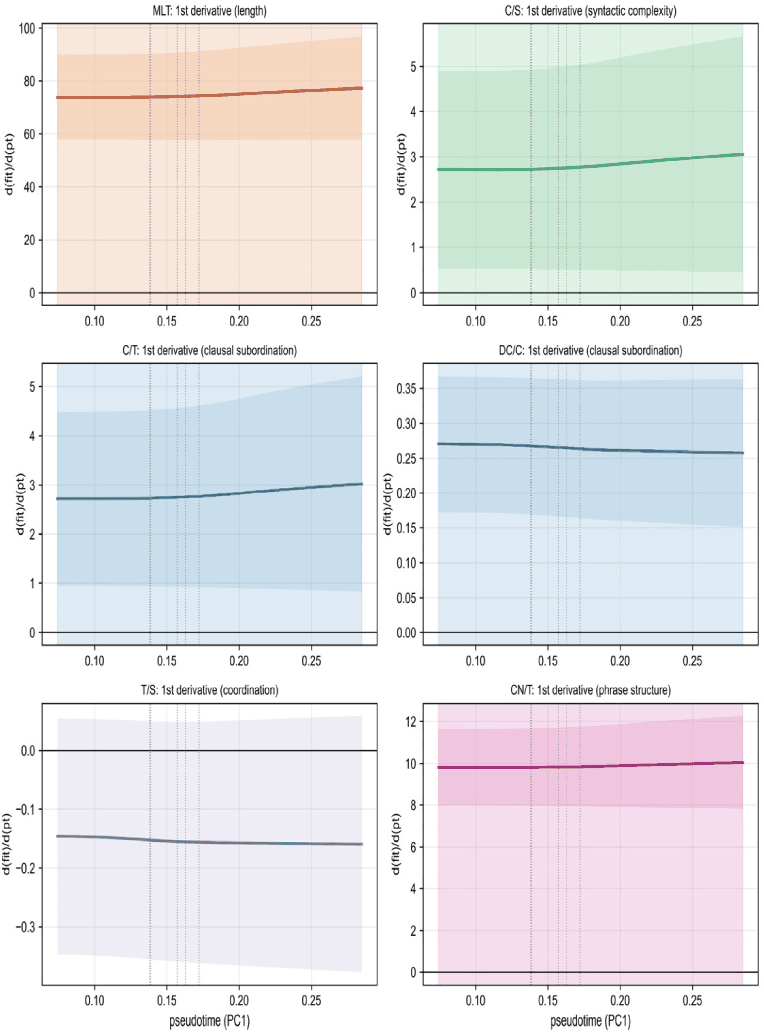
Except for T/S, five of the six indices showed significant increases with pseudotime. For these indices, the 95% simultaneous confidence bands for the first derivatives did not include zero across most of the evaluated pseudotime range, indicating statistically significant positive changes. The estimated total changes across the pseudotime axis were relatively large for MLT (Δ ≈ +15.8) and CN/T (Δ ≈ +2.1), while positive changes were also observed for C/T (Δ ≈ +0.59), C/S (Δ ≈ +0.60), and DC/C (Δ ≈ +0.06). Δ was calculated as the endpoint fitted value minus the starting-point fitted value. In contrast, T/S showed a slight decrease across pseudotime (Δ ≈ −0.03), but its first-derivative simultaneous confidence band included zero throughout the evaluated range, indicating no statistically significant change. Overall, the fitted curves were generally gradual, with no pronounced abrupt changes observed across the pseudotime axis.
5. Discussion
This study applied PCA to four syntactic complexity indices capturing clause-internal and phrasal elaboration to construct a pseudotime axis representing syntactic development and modeled how six other syntactic complexity indices varied along this axis. Interestingly, only T/S did not show a statistically significant change along pseudotime. Although its fitted curve exhibited a slight downward pattern, the 95% simultaneous confidence band for the first derivative included zero throughout the evaluated range, indicating that no statistically significant change in coordination was observed along pseudotime.
This finding is consistent with Norris and Ortega’s (2009) view that syntactic complexity develops through a progression from coordination, through subordination, to increasingly elaborate phrasal structures. In the present study, T/S did not change significantly along pseudotime, whereas indices of length, clausal subordination, syntactic complexity, and complex nominals increased significantly. This pattern suggests that, within the proficiency range of the present study, syntactic development was more closely related to clausal and phrasal elaboration than to coordination, which may have played a greater role at earlier stages. Given that the present dataset is concentrated largely at the intermediate proficiency levels, the observed pattern may reflect a developmental stage in which coordination has already become established, while clausal and phrasal elaboration continue to develop. Further, the findings of the present study support treating syntactic complexity as a multidimensional construct as they showed that different dimensions do not develop uniformly along the developmental axis.
The contribution of the present study is that it modeled a pseudo-developmental axis of syntactic complexity using PCA, an approach that has rarely been applied in L2 writing research. Because collecting longitudinal writing data over extended periods is often difficult and resource-intensive, particularly when the same learners must be tracked repeatedly over time, examining long-term patterns of syntactic development is challenging. Accordingly, this approach enables researchers to approximate long-term patterns of syntactic development without collecting longitudinal data over a prolonged period. It offers a practical way to investigate continuous patterns of syntactic development in large cross-sectional learner corpora when long-term longitudinal tracking is not feasible.
However, the present study has several limitations. First, although pseudotime represents syntactic development along a continuous scale, it should not be interpreted as actual longitudinal developmental time. The axis was inferred from cross-sectional learner data; therefore, the resulting ordering represents an estimated developmental continuum rather than an ordering directly observed in the same learners over time. To further validate the PCA-based pseudotime approach, longitudinal research is needed. Future studies should track the same learners over time to determine whether the patterns of syntactic change observed in the present study are also evident in within-learner development.
Secondly, because the pseudotime axis was constructed from four theoretically selected indices, using a different set of indices to construct the axis may result in different patterns of change in the present outcome variables along pseudotime, including differences in their direction, magnitude, and statistically significant intervals. This limitation suggests that the patterns of syntactic change observed in the present study may not represent fixed patterns of syntactic development but may instead be conditional on the choice of indices used to construct the axis. Therefore, future research should assess the robustness of the present findings to alternative index specifications through sensitivity analyses by reconstructing the axis using different sets of indices and examining whether the patterns of syntactic change observed in the present study remain consistent.
6. Conclusion
This study applied PCA to four theoretically selected syntactic complexity indices to construct a continuous developmental axis (pseudotime) and analyzed changes in six syntactic complexity indices along this axis using GAMs and bootstrap-based sup-t simultaneous confidence bands. The findings for the two research questions are summarized as follows. First, the constructed pseudotime axis tended to increase with higher proficiency levels and showed structural stability in the bootstrap analyses, thereby supporting its validity as a pseudo-longitudinal measure reflecting syntactic development. Second, along this developmental axis, indices related to length, clausal subordination, syntactic complexity, and complex nominals increased significantly, whereas coordination (T/S) showed no statistically significant change, suggesting that the various dimensions of syntactic complexity do not change uniformly along the developmental axis.
The results of the present study have implications in two respects. Theoretically, the fact that the subdimensions of syntactic complexity did not develop in a completely uniform manner provides empirical support for treating syntactic complexity as a multidimensional construct. Methodologically, the study offers a new analytical framework for learner language research in which longitudinal data are difficult to collect. By inferring a developmental ordering from large-scale cross-sectional data and examining the co-development of multiple indices along this axis, the approach provides an alternative means of investigating developmental patterns without directly observing change over time.
Nevertheless, pseudotime represents an inferred developmental continuum rather than actual longitudinal time, and its construction depends on the particular indices selected to define the axis. Thus, future research should validate the present methodology using actual longitudinal data and conduct sensitivity analyses with alternative sets of indices to determine whether learner ordering and patterns of change remain consistent across different pseudotime constructions.

