


1. Introduction
The World Health Organization (WHO) states that more than 300 million people, or one fourth of world’s population, have major depressive disorder (WHO 2018). Patients suffering from this illness have persistent feelings of sadness, lose interest in living, have difficulty in falling asleep, are easily exhausted, and lack attention when carrying out daily tasks. The WHO (2018) notes that the number of patients with depressive disorder increased by 18% from 2005-2016. Severe depression can lead to suicide. Statistics show that more than 800,000 people aged 15-29 with depression commit suicide each year and those between 15-29 years of age are the manpower of the nation. Research has shown that 50% of patients with depression eventually attempt suicide (Cummins et al. 2015). Consequently, the early detection of depression is vital. However, one report has shown that only 10% of patients with depression are cured in some countries (Liu et al. 2014).
As the number of depressive disorders increases, a report has claimed that depression treatment must be systematically developed in terms of the following three main factors: the quality of health professionals, their knowledge of interacting with depressed people, and the difficulties in accurately diagnosing depression. Chunjam et al. (2011), who analyzed reports on depression in Thailand, revealed that 183 reports were conducted between 1974-2007. The most frequently used method of diagnosis is the self-rating scale interview. Interviewing tools are constantly being developed, yet there are many limitations in conducting such interviews due to the fact that the assessments rely on the interviewees’ answers or judgments from the assessors (Losada & Crestani 2016). As a result, a number of researchers have developed other tools, such as biological marker assessments, which are believed to be more precise and accurate. Examples of biological marker assessments are face detection (Girard et al. 2013), gesture detection (Loi et al. 2013), eye movement detection (Carvalho et al. 2015), and utterances and suprasegmental features in speech (Liu et al. 2014).
Recently, linguistic markers for diagnosing depression have been reported to contain two components: speech utterances and suprasegmental features. Regarding utterance markers, Rude et al. (2004) and Zimmerman et al. (2016) evaluated the behavioral measures of self-focused attention by assessing the frequency of the usage of the words, “I”, “me” and “myself”. Here, it was shown that first person personal pronouns could be used to detect depression.
In addition to specific words used by speakers that have been shown to be useful in detecting depression, utterances such as “I don’t have much support” or “I feel like I can’t breathe” are also frequently uttered by depressed people (Chen & Jin 2017). Linguists have determined that a depression inventory can be identified through speech analysis. Angkapanichkit et al. (2019) studied Thai utterances that signal depression, including the frequency of word usage and the correlation between daily utterances and depression inventory. Thirteen utterances have been suggested to signal depression inventory in Thailand, including “I am wrong”, “I ruin everything”, “Let me go” and “Don’t worry about me”. These utterances demonstrate that depressive people tend to blame themselves, care about others, see themselves as victims suffering on the inside, and feel hopeless, helpless, and lonely. This study also found that the impersonal pronoun “we” was a signal of a lack of self-worth.
In analyzing suprasegmental features, Cummins et al. (2015) synthesized the use of suprasegments in human speech to evaluate depression and the risk of suicide. According to the findings of this research, various suprasegmental features are related to depression. In addition, acoustic analysis can be used to measure certain voice characteristics. Monotony, hoarseness, breathiness, and whispering are widely used registers by depressed people (Quatieri & Malyska 2012, Liu et al. 2014). Other studies have analyzed the relationship between depression and the length of pauses in speech (Ellgring & Scherer 1996, Mundt et al. 2007); speaking rate (Cannizzaro et al. 2004, Horwitz et al. 2013); loudness, including the measurement of the force of the air passed through the vocal cords; and speech rhythm (Williamson et al. 2016). All these features have been reported as linguistic cues capable of detecting depression (France et al. 2000, Trevino et al. 2011).
Some linguists have conducted acoustic analyses to measure suprasegments to assess the level of depression, such as evaluating depression based on pauses and loudness. Examples include studies by Bhuta et al. (2004) and Liu et al. (2014). Such research indicates that the fundamental frequency (F0) of depressive people is likely to be monotone, as depressed people feel hopeless. Yang et al. (2013) compared suprasegment characteristics in adults suffering from depression with non-depressed individuals and calculated the frequency of pauses and intensity. These researchers found that depressed people spoke with more pauses than people who were not depressed. In addition, those with major depressive disorders tended to take longer to speak than individuals not suffering from depression. Depressed people were hesitant when speaking, and therefore produced more frequent pauses. It was therefore shown that measurements of acoustics features, such as the number of pauses, reflected the level of depression (Vicsi et al. 2012). The research findings indicated that depressed adults spoke less loudly than those who were not suffering from depression. However, loudness measurements have not been frequently used in the research. Previous research findings have suggested that the measurements of acoustics features, such as fundamental frequency (F0) and pauses reflect the level of depression (Vicsi et al. 2012).
However, the majority of previous studies have been conducted in western languages, where pitch variations are not meaningful as in tone languages. The Thai language is classified as a tonal language, where tones are lexically contrastive pitches used to differentiate word meanings. Acoustically, Thai tones are either level or contour in shape, and these shapes play an important role in speech. Therefore, it is important to study whether the fundamental frequency of depressed people is in line with previous research conducted on non-tonal languages.
Furthermore, research assessing depression using suprasegments in human utterances is scarce. Most studies relate to risk factors for depression and the prevalence of depression (Chunjam et al. 2011, Rukkhajeekul 2013, Reangsing & Wongsuraprakit 2014). To identify more precise voice markers of depression, research concerning suprasegments in depression detection is needed (Bhuta et al. 2004), particularly in Thailand. At present, many Thai students suffer from depression. One fourth or 25% of students at Thammasart University have experienced depression (Angkapanichkit et al. 2019). It would be advantageous to be able to recognize whether youths in schools or institutions and working people are suffering from depression through analysis of the most reliable markers in daily life, particularly the fundamental frequency (F0) and silent pauses (Vicsi et al. 2012). Therefore, this study aims to analyze fundamental frequency (F0) and silent pauses in depressive teenagers compared to non-depressed teenagers.
3. Research Methods
This research analyzes the fundamental frequency (F0) and pause duration of three depressed Thai teenagers compared to three non-depressed Thai teenagers using an acoustic study.
In this study, the researcher reviewed related literature and then sought ethical permission to collect data. The ethical permission number from the university is 3/019/62 and ethical permission from Lampang hospital was granted. Two sample groups were used for this pilot study. Six Thai teenagers aged between 15-29 years old were selected, where the age range referred to a research by the WHO (2018).
The first group of participants were three teenagers who had medical certifications diagnosing F-32 depression or depressive episodes. The second group of participants were three teenagers who were certified by a medical doctor or psychiatrist as showing no signs of depression. Females were chosen, because they tend to be more frequently depressed than males. The selection criteria were based on the criteria used for selecting linguistics sample groups (Buchstaller & Khattab 2013).
The participant selection process was carefully conducted under doctor supervision and permission from the participants.
To process the data collection, the first step was to collect previous research carried out in Thailand. There are two ways that the Thai language can be used to signal depression: (i) words and utterances and (ii) speech.
The next step was to select a story to ask the depressed patients to provide a free speech sample. After extensive discussions with the doctor at Lampang Hospital, Thailand, a free spontaneous speech under the topic of ‘Our family’ was chosen for data collection and voice recordings. This type of speech aimed to depict natural speech compared to a reading method.
The sample groups were then asked to talk about their family and were recorded by a Sony recorder ICB BX140 model. The speech duration was lasted 5-7 minutes. In case of more severe signs from the participants during the recording (i.e., heavy crying, stress) the collection process stopped and continued again after 10 minute break.
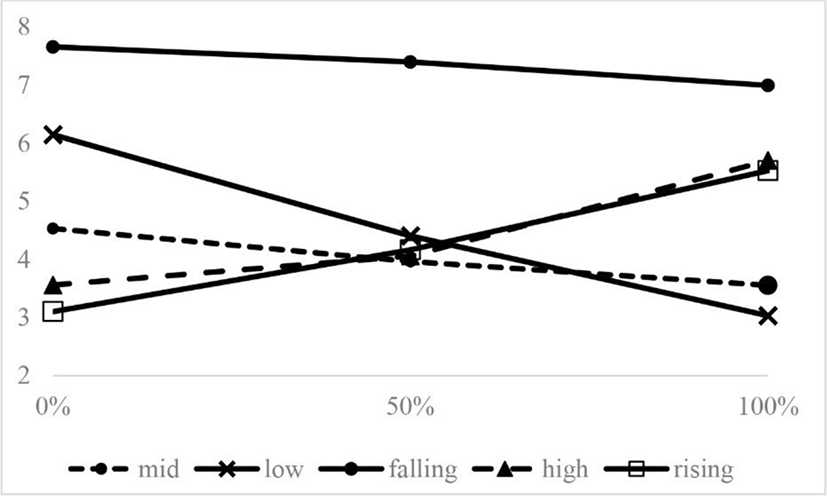
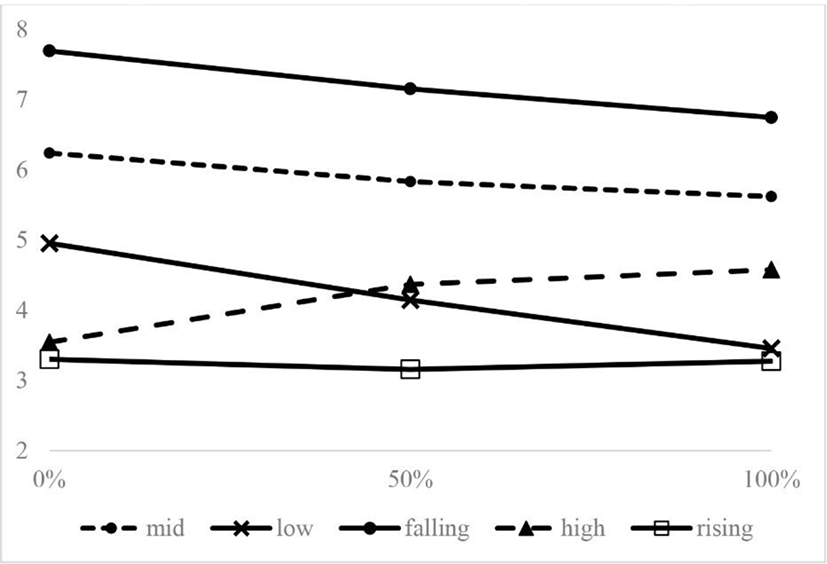
The speech of the participants was divided into segments. Each segment lasted for 1 minute. In measuring the fundamental frequency (F0), five tones in Thai—the mid tone [33], the low tone [21], the falling tone [31], the high tone [35], and the rising tone [323]—were measured. The first 10 words bearing each tone in the utterances were selected. There were 300 word tests (10 word tests×5 tones×6 participants) in the study.
The phonetics parameters were then analyzed. The phonetics values measured in this study were the fundamental frequency. The rate of vocal folds vibration is acoustically known as fundamental frequency (F0); However, pitch refers to human perception of the fundamental frequency. Tones are lexically contrastive pitches governing the whole syllables (Ding 2006, Abakah 2015). Therefore, the F0 (of Thai tones) were measured in Hertz (Hz) using Praat program version 06.2.09 and then transformed into semitone values (STs). The averages of the overall pitch of each Thai tone were calculated, namely the mid tone, the low tone, the falling tone, the high tone, and the rising tone.
The formula for the fundamental frequency conversion into ST was:
where X is the lowest hertz occurring in each sound
Meanwhile, the frequency of pauses was measured from the duration of each pause and number of pauses per passage. The unit used for measuring the pause duration was milliseconds. Silent pauses were counted per minute. The mean and standard deviation were used for the statistical analysis.
Silent pauses were labeled from the end of the previous sound the participants spoke to the first sound of the following word. For example:
In the example above, silent pauses were labeled from the end of [-s] in the word “hits” to the beginning to the word “me” and so forth.
After labelling the silent pauses, the pause duration was measured using Praat program version 06.2.09.
The unit used for measuring the pause duration was milliseconds. The mean, standard deviation (S.D.), and the Paired Sample t-test were used for the statistical analysis. The fundamental frequency at the mid-point was used to calculate the Paired Sample t-test between the fundamental frequency spoken by the depressed teenagers and that of the non-depressed teenagers. A table representing the research results was constructed.
The research results are divided into two sections: the study of linguistic markers of depression in Thailand and the acoustic study results.
There are two elements of the Thai language that can potentially signal depression: (i) word and utterance and (ii) speech.
Forms of language used by depressed patients were used to assess depression in this method. Rude et al. (2004) and Zimmerman et al. (2016) evaluate the behavioral measure of self-focused attention by assessing from frequency of the usage of the words “I”, “me” and “myself” when talking about oneself. The findings revealed that patients suffering from depression tended to use the word “I” frequently. As such, it can be said that first person personal pronouns can be used to detect the level of depression.
As well as certain words, sentences such as “I don’t have much support” and “I feel like I can’t breathe” also appear in the utterances of depressed people (Chen & Jin 2017). Recently, linguists have found that the depression inventory can be identified through speech analysis.
Over the past few decades, little research has been conducted on the depression inventory with linguistics markers in Thai. Angkapanichkit et al. (2019) studied Thai utterances that signal depression, including the frequency of word usage and the correlation between daily utterances and depression inventory.
Suprasegments are used to assess depression in this method. In other words, this method measured the phonetical values of utterances.
A suprasegment is a speech feature that is added over consonants and vowels. Examples of suprasegments include pauses, loudness, pitch, intonation and stress.
Linguists have discovered that the characteristics of suprasegments can help assess the level of depression. Therefore, this research presents a depression assessment through phonetical values, such as assessing depression from pauses and their frequency; speech loudness, rhythm, pitch; and registers (e.g. hoarseness, whispering).
The results revealed that depressed patients had slow and inconstant pauses, while individuals not diagnosed with depression did not exhibit these kind of pauses in their speech. There have been some studies on the meaning of pause duration (Ellgring & Scherer 1996, Mundt et al. 2007). Some studies have found that major depression patients tend to take more time in speaking than patients without depression (Vogel et al. 2011). Depressed patients hesitate when speaking, which causes a range of lengths of pauses. It can be said that phonetics values, such as the ratio of utterances to pauses and the speaking ratio, reflect the level of depression (Vicsi et al. 2012).
Speech volume adjustments, including the measurement of the force of air passed through the vocal cords, is also a marker in the depression inventory. Moreover, the results of the present study also indicated that adults with depressive disorder had a lower intensity (loudness) than non-depressed adults. However, some researchers have concluded that loudness is not useful in identifying depression (Williamson et al. 2016).
Vogel et al. (2011) discovered that depressed people spoke more slowly than non-depressed people. It has been found that rate of speech (Cannizzaro et al. 2004, Horwitz et al. 2013) and rhythm of depressed speech (Williamson et al. 2016) are crucial markers in the depression inventory.
Some studies have shown that, apart from pause and loudness, the pitch associated with the fundamental frequency is another suprasegment that can also be used to identify the level of depression. Nilsome (1998) discovered differences in the pitch of depressed patients before and after treatment, where the pitch of patients suffering from depression was lower compared to their pitch after receiving treatment. Breznitz (1992) also conducted research that determined the same result.
Certain registers (e.g. monotony, hoarseness, breathiness and whispering) are prominent registers used by depressed people. These kinds of suprasegments (Quatieri & Malyska 2012, Liu et al. 2014) can be heard in depressive people.
Previous studies have been conducted in countries that do not have the same language structure and tone markers as the Thai language. The phonetics parameters tested in the previous studies were pauses and their frequency; speech loudness (intensity), rhythm, pitch (fundamental frequency); and registers. It was found that pauses, pitch, rhythm, and registers in speech could be used to differentiate between depressed and non-depressed participants (people). However, loudness was not a robust speech cue in determining depression.
The ST values of Thai tones and silent pause duration were assessed in three Thai participants who were diagnosed with depression and three Thai participants not diagnosed with depression.
From Table 1, it can be seen that pitch values or ST values of depressed people were higher than the non-depressed individuals in terms of the mid tone, low tone, falling tone, high tone and rising tone.
In depressed speech, the ST values of the mid tone, low tone, falling tone, high tone and rising tone were 3.09, 2.48, 3.06, 3.31 and 2.19, respectively, compared to the values of non-depressed speech, which were 5.89, 4.18, 7.20, 4.55 and 3.30. As the Standard deviation (S.D.) shows how measurements for a group are spread out from the average (mean), the S.D. values in Table 1 confirm that the pitch values of each tone were close to the mean of the data set.
Figure 1 shows five Thai tone shapes produced by depressive teenagers, while Figure 2 shows five Thai tone shapes produced by non-depressive teenagers. When comparing the tone shapes in Figures 1 and 2, it is clear that the depressed individuals’ tone shapes were not monotone. The high tone and rising tone of the depressive teenagers clearly rose compared to that of the non-depressed teenagers. The mid tone, low tone and falling tone of the two groups showed no differences. The Paired Sample t-test of the ST values in Thai tones spoken by the depressed teenagers were not significantly different from that of the non-depressed teenagers.
Regarding the length of pauses, the length of the pause values of the depressed teenagers was significantly higher (See Table 1, p=0.03), at 618.93 milliseconds compared to 462.39 milliseconds in non-depressed teenagers. In the final section, the pause frequency per minute in the speech of depressed teenagers was higher than the non-depressed teenagers at 34 times per minute compared to 20 times per minute. Therefore, the pause length in the depressed teenagers was approximately 1.5 times longer than that of the non-depressed teenagers.
4. Discussion
This study began by synthesizing previous related research to linguistic markers in depressive Thais and analyzed the fundamental frequency values or the ST values and length of pauses of three depressed Thai participants (teenagers) compared to three non-depressed Thai participants. Not many studies focusing on the depression inventory and speech in Thai could be identified. For the most part, studies provide definitions of depression, discuss the causes of depression, classify the types of depression, prevalence of depression, depression inventory, and depression inventory with linguistic markers in Thailand (Chunjam et al. 2011, Rukkhajeekul 2013, Reangsing & Wongsuraprakit 2014).
In terms of the depression inventory with linguistic markers in Thailand, there are two forms of language used to signal depression in Thailand: (i) words and utterances and (ii) speech. It was found that early detection of the signs of depression could involve a combination of depression inventory (i.e., observation, self-scored or self-rating scale depression inventory) and speech signs, such as self-focused attention by the frequency of the usage of the pronouns and utterances “I”, “me”, “I am wrong”, and “It is all my faults” (Rude et al. 2004, Zimmerman et al. 2016, Angkapanichkit et al. 2019). First person pronouns could be used to detect the level of depression. In addition to specific words, certain utterances may also be useful in the detection of depression (Chen & Jin 2017).
With respect to the second objective of the study, the ST values of the three depressed Thai teenagers comparing to that of the three non-depressed Thai teenagers were not significantly different. Each tone shapes spoken by the depressed Thai teenagers comparing to that of the non-depressed Thai teenagers were also similar. However, the pause length in the depressed teenagers were found 2 times longer than that of the non-depressed teenagers.
This finding conflicts with previous studies, which reported monotony, hoarseness, breathiness, and whispering as speech markers of depression (Quatieri & Malyska 2012, Liu et al. 2014). Thai tones yield both level and contour tones, and pitch in non-depressed Thai speech was found to be monotone compared to non-depressed speech. This finding is dramatically different from other non-tonal languages studied in previous research in that the fundamental frequency values were observed to be high in non-depressed people. Yang et al. (2013) state that “as depression became less severe, interviewer F0 became higher and less variable.” In contrast, this present study showed that “as depression became more prominent, the fundamental frequency values became clearer.” It is possible that the depressed participants emphasized certain words to grab the listener’s attention. Moreover, as the pause length was long in depressed participants, this suggests that depressive speech is slow and clear, causing tones to appear prominent in shape.
The pitch of the voice as part of a depression inventory appears to be relevant to non-tonal languages, but not to tonal languages. Non-tonal languages and tonal languages showed relatively different results because there are more contour (changes in F0) or more dynamic tone height and shapes in tonal languages. That is, most non-tonal languages have non-contour tone structures where the discriminating characteristic is the difference between the pitches rather than the tone shapes.
However, the results are in contrast with Jiang et al. (2018)’s findings, which are also based on tonal language, with regard to distinct research design. Jiang et al. (2018) classified prosodic (including F0), spectral, and glottal speech features in recognition of depression and proposed a logistic regression model for detecting depression (ELRDD) in Chinese speech. The model revealed a high accuracy level of depression detection.
The results of the pause duration in this study were in the line with findings by Ellgring & Scherer (1996) and Mundt et al. (2007), who showed that pause duration and frequency of pauses could be used to detect depression (France et al. 2000, Trevino et al. 2011, Yang et al. 2013). The present study found that depressed people had slow and inconstant pauses, whereas non-depressed individuals did not show such results.
The results of pauses in this study indicate that depressed people were uncertain when speaking, so they spoke with a higher range of pauses, as also reported by Vicsi et al. (2012).
It is suggested that structure of language could be a limitation for speech marker and depression inventory. Monotony is not a significant signal for depression in tonal languages. For all that, it is not exactly clear whether the tonality of Thai affects the quality of the production due to a small number of participants in this study. On the contrary, the pause can be used as a signal for depression. While this research results tested positive for pause length, speech may have additional features that applicable to depression. In Chinese language, Jiang et al. (2018) suggested multiple speech characteristics to detect depression; therefore, the combination of prosodic features, spectral features and glottal features could be more relevant to depression diagnosis.
Compared to previous research, it is suggested that depression diagnosis from speech involves a combination of two or more features (e.g. pauses and word signs, pauses and speaking rate). Therefore, it is shown that speech analysis could be early indicator useful in the detection and prevention of depression in Thailand.
On the one hand, the strength in this study is that it showed natural speech data from depressed teenagers in the hospital. On the other hand, a limitation of this study is that the research was conducted with 3 depressed Thai teenagers which was identified as a case study. As relatively little research has been conducted on linguistics aspects of depressive people in Thailand, further research can examine on Thai tones in isolated words spoken by depressed participants or conduct a study with a larger number of participants with various linguistics aspects of Thai depressive speech.
5. Conclusion
This study analyzed the fundamental frequency and speech pauses of a group of Thai teenagers with depression and those of a group without depression. It is suggested that pause length, but possible not fundamental frequency, is an applicable cue to depression. There is a relationship between depression and the length of pauses in speech. The pause length in the depressed teenagers was around 1.5 times longer than that of the non-depressed teenagers. Speech indicators can be a combination of two or more cues in detecting depression. Pauses with word signs can be indexes for depressive detection.